Hydro-Energy Harvesting System
The Objective
The objective of the project was to develop a system that efficiently harvests energy from water and delivers it to the user through a USB port. Through utilizing the Quality Function Deployment (QFD) process, electrical, mechanical, and user requirements were established. User surveys highlighted the importance of reliability, safety, and efficiency, guiding the design priorities.
Overview
Three design configurations: an impeller, a propeller, and a waterwheel were evaluated. Each design aimed to optimize different aspects of the energy conversion process, with the impeller design ultimately proving most efficient based on the simulations and tests. The chosen impeller design interfaces with the existing pipe via a flexible coupling and is mounted on a board for stability. The initial impeller had a diameter of 140mm, which was adjusted based on testing data. The housing, designed for serviceability, features a two-component body with a flexible TPU grommet for sealing. Computational Fluid Dynamics (CFD) simulations were employed to refine the design, iterating on mesh refinement and analyzing static forces. The placement of the turbine, evaluated through pump and system curve diagrams, further optimized performance by minimizing head loss and maximizing dynamic pressure. The experimental design, using the 2K Factorial Approach, tested different turbine positions and blade numbers. Results showed that a low-position, eight-blade impeller provided the highest power output, while a high-position, twelve-blade configuration was least efficient. Final testing yielded an output of 10V and 14mA, resulting in 0.14 Watts. Despite not meeting system requirements, the revised seal design minimized leakage. Future iterations will focus on enhancing mechanical and electrical aspects, including improved sealing, material selection, and impeller design. Overall, the project demonstrates the potential for efficient water-based energy harvesting, with ongoing refinements expected to further improve system performance and reliability.
Introduction
This project aims to design, build, validate, and test a proof-of-concept device that harvests energy from moving water and provides a 5VDC USB-A output. Intended for remote communities without an existing power grid but with access to a running water source, this system can charge a phone, run a light, or operate a small fan, extending the day for people who lack light after sunset and aiding the development of these areas. To maximize power output, reducing mechanical, electrical, and fluid losses were the primary focuses. Various designs were developed, including an impeller, propeller, and waterwheel, each configured to maximize efficiency.
Procedures
Electrical Requirements
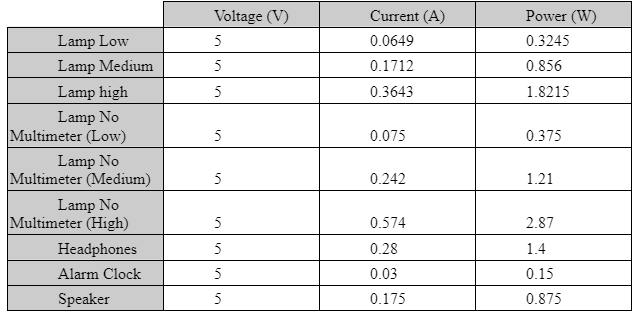
The first step was to quantify the power draw of various small USB devices to better understand what power the system would need to be able to deliver. As seen in Appendix 1, based on the USB protocol, the device needs to be able to deliver power at 5VDC[1], and the current will vary based on the device plugged in. In testing, the maximum amount of power draw was 2.87W which is what drove the power requirements for the system.
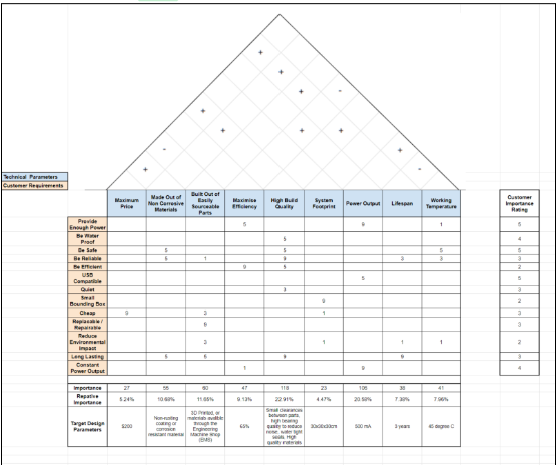
System Requirements + QFD
A QFD was built to see how the user requirements correlate with the technical parameters. The sub-systems were then designed to match the output of the QFD. Specifically, high build quality, and high power output were found to be the most important factors, so extra time was allotted into refining these parameters. The goal was to minimize clearances, use high-quality materials, and minimize leakage where possible. Also, the aim was to have enough power to power charge a phone (around 500 mA). See Appendix 2 for QFD.
Functional & Physical Decomposition
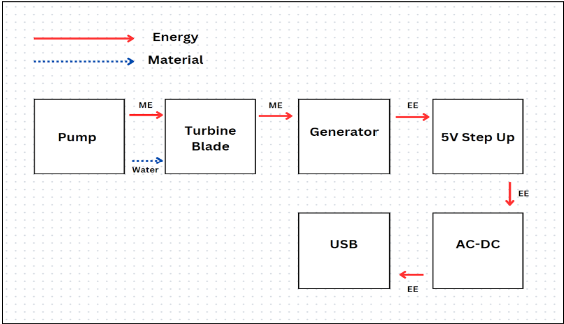
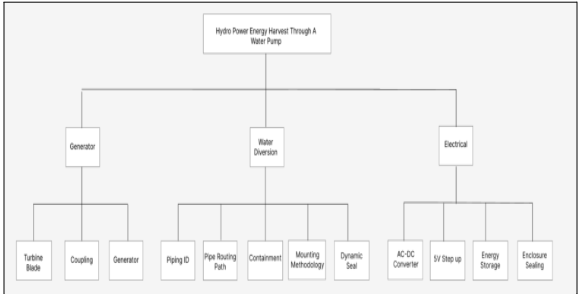
Beginning with a functional decomposition the high-level objective was broken down; convert kinetic energy from moving water from a pump into power that can operate a small USB device (See Appendix 3). Next, the functional decomposition was broken down into a physical decomposition, identifying components that would be needed for the system (See Appendix 4).
Morphological Chart
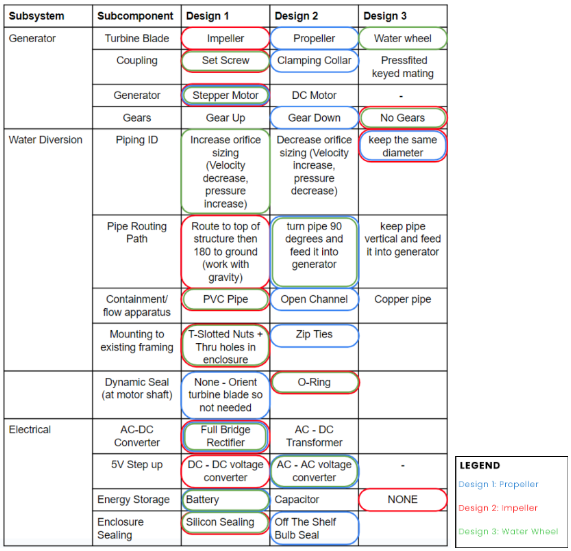
As shown in Appendix 5, a morphological chart was used to systematically explore and evaluate different design configurations. The system was broken down into subcomponents, such as the turbine blade, coupling, and generator, and identified design options for each. This structured approach allowed us to consider a wide range of possibilities and combinations.
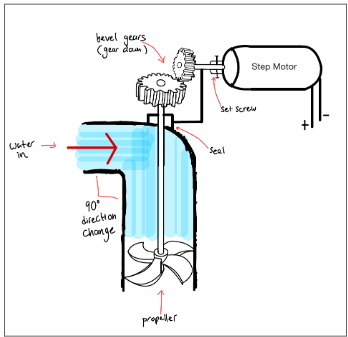
The propeller design is a simple and proven design, commonly used in boats [2]. It features a 90-degree direction change. However, this design has its drawbacks, including the possibility of lost work and difficulty in sealing the shaft to the elbow [2]. See Appendix 6.
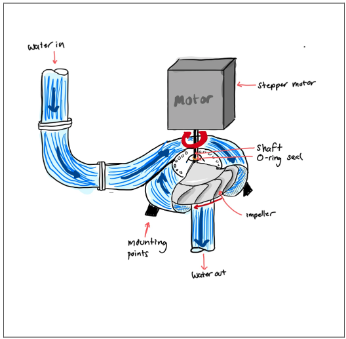
The impeller design is well-established in pump systems. The SolidWorks simulation [3] of the impeller showed that it was the most efficient of the three designs. Additionally, a study conducted by Yue Zhang and Chenchen Song [3] converts mechanical energy into kinetic energy more efficiently. See Appendix 7.
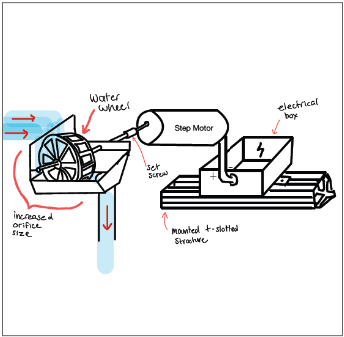
Finally, the waterwheel design is also simple and proven, especially in historical contexts [4]. However, drawbacks include no pressure containment and a higher possibility of spilling, contributing to greater friction and turbulence, thereby reducing overall efficiency [4]. See Appendix 8.
The thorough analysis and external research led us to conclude that the impeller design is the best choice for the system, providing the highest efficiency and reliability.
Pump Efficiency Calculations
Since the CFD only models the flow when the impeller is stationary, this only accurately reflects the system at startup, not at steady state. Knowing that, parametric equations were derived to find optimum values for the design.
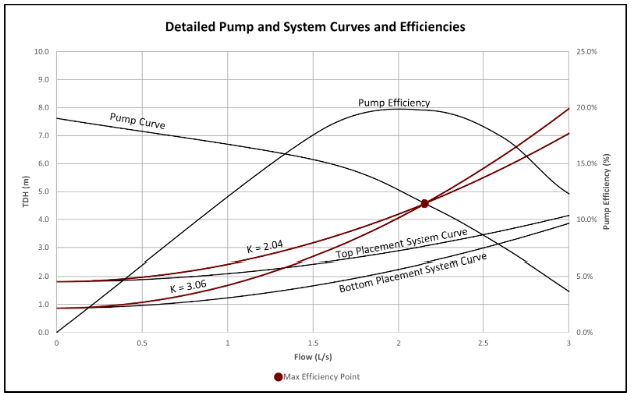
Specifically, whether to put the turbine assembly at the top or bottom of the frame needed to be determined. At the top of the frame, the pump would have to pump the full head of 1.81 meters, however, due to the shorter pipe length, the friction losses are lower. At the bottom, the pump only has to pump 0.87 meters of head due to the suction of the water pulling it up as it moves down, however, due to the longer pipe length, the friction losses are higher.
The impeller was designed to operate at the pump’s maximum efficiency point (to minimize losses throughout the system). At that point, the bottom placement has 0.57m less head loss compared to the top placement. This equates to around an extra 12.1W. See Appendix 9.
Impeller Diameter Calculation
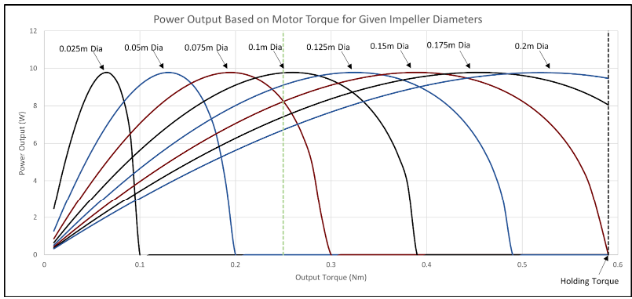
A parametric equation was derived for impeller turbine efficiency from motor torque and impeller diameter. See Appendix 10 for the calculation summary. It is known that speed is roughly inversely proportional to torque, however, since the exact relation is unknown, the motor torque was assumed to be around half the holding torque. Using this calculation, the ideal impeller diameter was determined to be 100mm. See Appendix 11.
A manometer setup was used to quantify the volumetric flow rate of the water, which would be used to define the environmental setup for the CFD simulations. The difference in water height on either side of the orifice was determined to be 32cm which equates to 1.08 L/s. This value aligns roughly with the theoretical flow rate from the pump curve. See Appendix 12 for detailed formulas.
Flow Rate Quantification
A manometer setup was used to quantify the volumetric flow rate of the water, which would be used to define the environmental setup for the CFD simulations. The difference in water height on either side of the orifice was determined to be 32cm which equates to 1.08 L/s. This value aligns roughly with the theoretical flow rate from the pump curve. See Appendix 12 for detailed formulas.

CFD [6]
Computational Fluid Dynamics (CFD) was used to approximate torque output from the impeller. An internal simulation was developed using a static part containing the impeller and housing. The outlet was exposed to environmental pressure, while the inlet had a flow rate defined as 1.08 L/s. A surface goal was set up to look at the force applied to the surface of the impeller blade which is perpendicular to the inlet.
An initial mesh was developed that was more refined around the walls of the housing impeller. This is due to flow being less predictable around walls due to the no-slip condition [7]. This initial coarser mesh was used to validate that the model behaved predictably.
After confirming that the model would cover and behave appropriately, further iterated were conducted by refining the mesh and re-running the simulation. See Appendix 13 for the final generated mesh. This process was repeated until results converged to a single value: 2.057N. Knowing the dimensions of the current impeller blade, assuming an even force distribution against the blade and approximating the blade as a rectangle, an output torque of 5.123Ncm. These results were deemed acceptable based on prior calculations that reflected the needed torque applied to the motor to achieve the desired power output from the generator.
These results likely have a large margin of error associated with them. This is because the stationary impeller within the housing would not have a flow path representative of that if the impeller was able to rotate within the model. The other piece to consider is the fact that the flow path is likely highly turbulent and therefore unpredictable which could result in inconclusive results [8].
Granta [9]
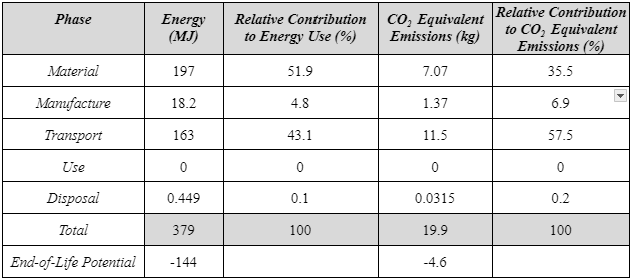
Appendix 14 illustrates the relative contribution of energy consumption and CO2 equivalent emissions of the device throughout its life cycle stages. The materials phase contributes approximately 45% of total energy consumption and 35% of CO2-eq emissions. The transportation phase significantly impacts both indicators, accounting for about 43% of energy consumption and 57% of CO2-eq emissions. The manufacturing stage has a small impact, and the use stage has no contribution. The disposal stage's impact is negligible, while the end-of-life (EoL) potential shows significant benefits from recycling or remanufacturing, reducing overall energy consumption and CO2-eq emissions by approximately 30%.
An important point to note is that the raw materials for the energy harvesting system, including PVC pipes and PETG feeding tubes, are transported from India and China to Canada. This transportation process involves significant energy consumption and CO2-eq emissions, as shown in Appendix 15. The extensive transport results in notable environmental impact, highlighting the need for efficient logistics and the potential benefits of local sourcing.
TCP
A TCP is a tool to explore the concept of circular value chain redesign [11]. It encourages users to consider how each phase of the product’s life cycle contributes to the circular economy to pinpoint areas for improvement. In the analysis, a linearity score of 5.00 was achieved. See Appendix 16 for the TCP Analysis results.
The lowest score was given in the raw material phase, which is the most linear. This is mostly because many of the raw materials come from non-renewable sources, such as the fossil fuels that are used to create the polymers in the assembly [11]. Some components used within the circuit board and stepper motor contain rare earth metals, which have high energy and carbon footprints associated with their respective mining processes [12].
A high score was allotted to the product phase due to the design of the device which allows for easy repair of subcomponents, rather than disposing of it due to a single part failure. A score of 6 was given to the 1-use phase. This is because the target lifespan of the device was 3 years which was a technical requirement defined through the QFD which related to the average lifespan of a cell phone [13]. However, there are no energy consumption or emissions associated with its operation. At the end of the product life, some components can be recycled, leading to the allotted score of 5. PVC piping can be recycled, but it is not often are not due to the complexity, energy consumption associated with the process, and toxic byproducts produced[14][15].
In conclusion, some aspects of the design are closer to contributing towards a circular economy, although there is some room for improvement, especially when it comes to sourcing raw materials.
Electrical Design
The circuit was designed from a 3-phase rectifier circuit, however, that worked on the difference between the 2 phases, so when they were equal, the power output was zero. By adding the diodes to the capacitor high and low, when both phases are the same, the current will either flow from or to the ground and there will be a voltage differential across the capacitor. See Appendix 17 for the final schematic and Appendix 18 for output.
Initial Design
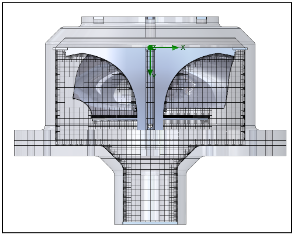
The initial design consisted of a 3D-printed housing that separated into 2 components: the body and the lid. PLA was chosen as it was available in the Rapid Prototyping Center and it has a higher recyclability fraction than its alternative PETG [14]. A TPU gasket was printed between the parts to provide a more appropriate seal. The bolt pattern was designed to try to remove unnecessary material and was going to be further validated through testing. See Appendix 19 for an exploded view of the housing.
The piping setup was designed to interface with the existing frame as well as the housing inlet through a 1 1/4in flexible pipe coupling. The pipe diameter was chosen to remain constant throughout the setup as impeller diameter was iterated as the variable to be optimized. The entire setup rested on a plywood board with L-brackets to hold it in place and had a hole where the outlet would sit to locate the assembly relative to the frame. See Appendix 20 for a render of the entire assembly and Appendix 21 for an image of the full assembly.
Data & Analysis
Experimental Design Data - Factorial Approach 2K
An experimental design using a 2K factorial approach was implemented to further understand the impact of each design factor on the system. The number of blades and the position of the turbine were selected as the two controlled inputs. As Appendix 22 below indicates, the system generates the most power when there are 8 blades placed at the bottom of the frame. Conversely, the configuration with 12 blades placed at the top of the frame produces the least power output. See Appendix 23 for experimental results.
By calculating the impact of the number of blades and the turbine position on system power output, increasing the blades from 8 to 12 was found to result in a power decrease of 272.85 mW. Additionally, raising the turbine position from the bottom to the top of the frame causes a power decrease of 29.25 mW. See Appendix 24 for calculations describing the linear relationship between variables and output power.
The power output decreases with more blades due to higher mass and resistance. A higher turbine position results in less potential energy and hydrostatic pressure, thus reducing power output. Comparing the calculated results, it was determined that the number of blades has a more significant impact than the turbine position. See Appendix 25 and Appendix 26.
Final Design
The 2K experiment yielded several key insights regarding the prototype's performance. The primary conclusion was that the optimal performance among the four tests was achieved with a low-position, eight-blade design. However, the prototype exhibited several issues, such as piping problems, loosening shaft coupler, and significant leaking from the impeller housing.
For the final design, changes were made based on experimental findings. An eight-blade impeller was used, mounted the assembly at the bottom, altered the bolt pattern for a better seal, repositioned the inlet to allow for bolt clearance, increased housing wall thickness to reduce buckling, and changed the impeller diameter to 100 mm according to the diameter calculation.
Conclusion & Recommendation
Final Results
Final testing yielded 10V and 14mA, resulting in only 0.14 W, which did not meet the system requirements. The unexpected 10VDC output deviated from the designed specification of maintaining 5VDC. The circuit was tested again afterwards and behaved as expected, outputting 5V. Regarding the impeller's function, the revised design was successful. There was minimal leakage, limited to the top, the shaft coupler remained secure, and the piping stayed intact.
Next Steps
In terms of mechanical improvement, an o-ring dynamic seal would be used to seal the spinning shaft against the housing [16]. Different impeller shapes would be tested to determine which impeller most effectively moves water flow to the exit and provides the most power output. The impeller shape will be altered to reduce losses and increase efficiency. The bolt pattern would be altered again for easier serviceability since currently there are a lot of bolts in awkward positions.
For electrical factors, a full system testing with motor input, instead of only a function generator, would be needed to have a more accurate understanding of the further debugging that needs to be done to ensure that the electrical system functions optimally.
In conclusion, implementing all these mechanical and electrical factors into the next iteration will allow the system to function at its optimal level.
References
[1] R. Kollman and J. Betten, “Powering electronics from the USB port,” TI, https://www.ti.com/lit/an/slyt118/slyt118.pdf?ts=1719780295741&ref_url=https%253A%252F%252Fwww.google.com%252F (accessed Jul. 26, 2024). [2] D. Radojcic, “Tip-Driven Marine Propellers and Impellers - A Novel Propulsion Concept,” ResearchGate, https://www.researchgate.net/publication/328413537_Tip-Driven_Marine_Propellers_and_Impellers_-_A_Novel_Propulsion_Concept (accessed Jul. 26, 2024). [3] Y. Zhang and C. Song, “A novel design of centrifugal pump impeller for hydropower station management based on multi-objective inverse optimization,” MDPI, https://www.mdpi.com/2227-9717/11/12/3335 (accessed Jul. 1, 2024). [4] A. Zaman and T. Khan, “Design of a Water Wheel For a Low Head Micro Hydropower System,” Journal Basic Science And Technology, 2012, https://www.researchgate.net/profile/Ayesha-Zaman-2/publication/267958992_Design_of_a_Water_Wheel_For_a_Low_Head_Micro_Hydropower_System/links/54c01ddb0cf21674ce9e1272/Design-of-a-Water-Wheel-For-a-Low-Head-Micro-Hydropower-System.pdf (accessed: Jul. 26, 2024). [5] “Discharge Coefficient for Nozzles and Orifices,” Neutrium, https://neutrium.net/fluid-flow/discharge-coefficient-for-nozzles-and-orifices/ (accessed Jul. 26, 2024). [6]Dassault Systemes, Solidworks [2023] [7] Patrick Knupp, “Remarks on Mesh Quality,” United States: N. p., 2007, https://www.osti.gov/biblio/1146104 (accessed: Jul. 26, 2024) [8] J. SODJA and R. PODGORNIK, “Turbulence models in CFD,” Mar. 2007, http://www-f1.ijs.si/~rudi/sola/Turbulence-models-in-CFD.pdf (accessed: Jul. 26, 2024). [9] J. Goddin, “Granta - software tools and solutions.” IET, Stevenage, 2015 [10] A. Mizielińska, D. Mizieliński, and A. Lloyd-Jones, Maps, Big Picture Press, an imprint of Candlewick Press, Somerville, MA, 2013 [11] C. Garcia-Saravia Ortiz-de-Montellano, A. Ghannadzadeh, and Y. van der Meer, “The circular pathway: A new educational methodology for exploratory circular value chain redesign,” Frontiers, https://www.frontiersin.org/articles/10.3389/frsus.2023.1197659/full (accessed Jun. 15, 2024). [12] S. P. Renée Sharp, “Hidden fossil fuels: Plastic production drives climate change,” Be a Force for the Future, https://www.nrdc.org/bio/renee-sharp/hidden-fossil-fuels-plastic-production-drives-climate-change (accessed Jun. 15, 2024). [13] M. Cordella, F. Alfieri , C. Clemm, and A. Berwald, “Durability of smartphones: A technical analysis of reliability and repairability aspects,” ResearchGate, https://www.researchgate.net/publication/347351284_Durability_of_smartphones_A_technical_analysis_of_reliability_and_repairability_aspects (accessed Jul. 26, 2024). [14] M. Sherburne, “U-M team recycles previously unrecyclable plastic,” University of Michigan News, https://news.umich.edu/u-m-team-recycles-previously-unrecyclable-plastic/ (accessed Jun. 15, 2024). [15] J. Reynolds, “PETG/PLA recycling: How to Recycle 3D printer waste,” Nikko Industries, https://www.nikkoindustries.com/blogs/news/petg-pla-recycling-how-to-recycle-3d-printer-waste (accessed Jun. 15, 2024). [16] “O-Ring Basics,” Apple Rubber, https://www.applerubber.com/src/pdf/section3-o-ring-basics.pdf (accessed Jul. 26, 2024).